Knin
Climate change projections for Knin with special emphasis on severe
impacting events
Authors: CMCC, ARPAE, DHMZ
contact person: enrico.scoccimarro@cmcc.it
Expected climate change for Knin pilot area
Expected climate change presented in this short document is the summary of the ADRIADAPT D.3.3.1 document – Climate change projections for Knin with special emphasis on severe impacting events. For more information on the data used, processing and analysis methods, graphical representations of the results and conclusions, we advise to look at this document.
1.1 Dynamically downscaled
In this section we present future climate change of temperature and precipitation related indices, surface relative humidity and extra rare humidex projections for Knin. All indices are calculated from the available data set of regional climate models for the model point representing the location of Knin. Data set is obtained by interpolation of data from neighbouring points. All data are presented as follows:
- Climate change diagram of an individual index in seasons: DJF standing for the months of the winter season, MAM for the months in spring, JJA for the summer months, and SON representing the autumn months. Data is presented furthermore and on annual basis for four future periods: 2021-2040, 2041-2060, 2061-2080 and 2081-2100 and for two emission scenarios: a moderate one called also stabilization scenario (RCP4.5) simulating a future world where considerable efforts have been put into mitigation policies and a high-emissions climate scenario (RCP8.5, often called pessimistic climate scenario) which simulates a future world without climate mitigation policies. We calculated indices representing the difference between present and future climate (called also future anomalies or changes). Reference period is 1985-2006 and a star marks such values for which changes are statistically significant.
- Time series of the future anomaly (or changes) of an individual index for the winter (DJF) and summer season (JJA) for RCP4.5 and RCP8.5 emission scenarios. Anomaly is calculated concerning the reference period and shown for the individual models, the mean and the 5-year average. Statistical trend test is applied to the ensemble mean (for 95 % confidence level). A significant trend is marked with a star (ns if not significant).
1.2 Statistically downscaled
In this section, we present future climate changes of temperature and precipitation related indices for Kin, simulated by the statistical downscaling techniques set-up on the observed local data/observed large scale circulation patterns and then applied to the future large-scale circulation patterns simulated by four models. The results are presented as follows:
- Climate change diagram of an individual index for each season and on annual basis for four considered future periods: 2021-2040, 2041-2060, 2061-2080, 2081-2100 and the two emission scenarios (RCP4.5 and RCP8.5). Anomalies or future changes are calculated as a difference between future and reference period for temperature indices and some intense precipitation indices, and as their relative differences (expressed in % for precipitation). The reference period (noted as Ref. mean or obs.) is 1986-2005, the climate observed value is the one registered at the meteorological station, while the values for the different periods in the future are shown for the different climate models as well as for the ensemble mean of those models (ENSMEAN). A statistical test is applied to test the significance of future climate change with respect to the present climate value. The results considered as significant are marked by a star.
- time-series of a future anomaly of an individual index for winter and summer and for two emission scenarios; the anomaly is calculated with respect to the reference period and shown for individual models, the ensemble mean and 5-year moving average. A statistical trend test is applied to the ensemble mean. A significant trend is marked with a star (n.s. if not significant).
2 Temperature related data
2.1 Results from dynamical downscaling (DD)
2.1.1 Averaged 2 meter air temperature
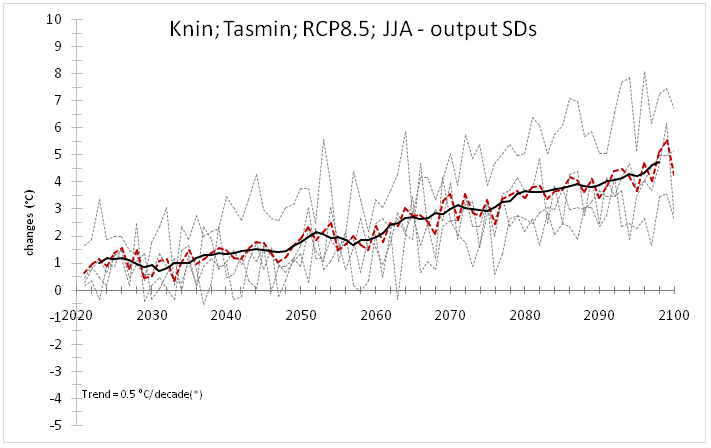
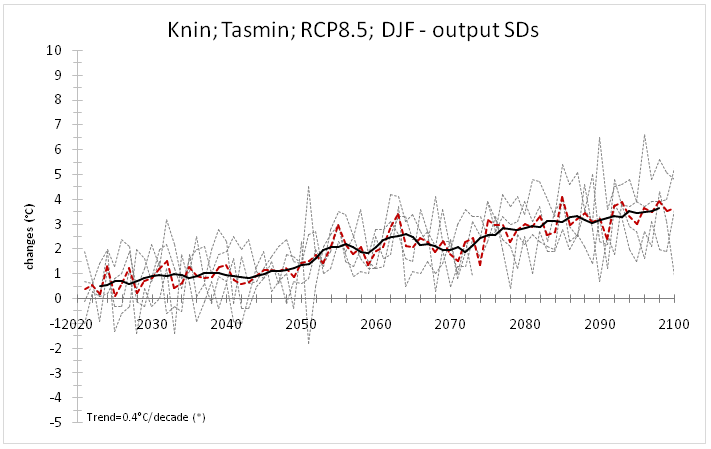
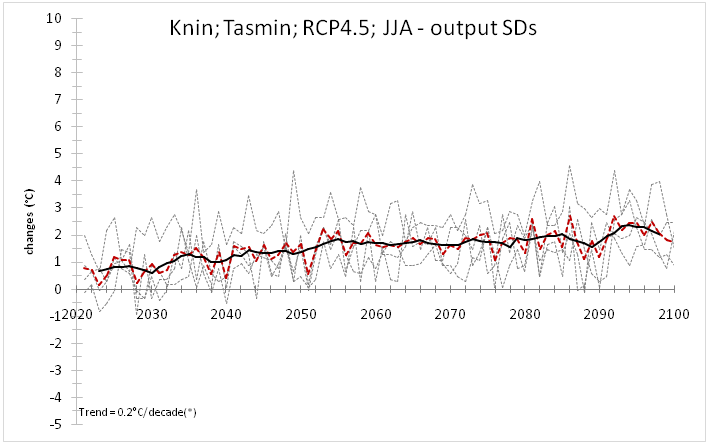
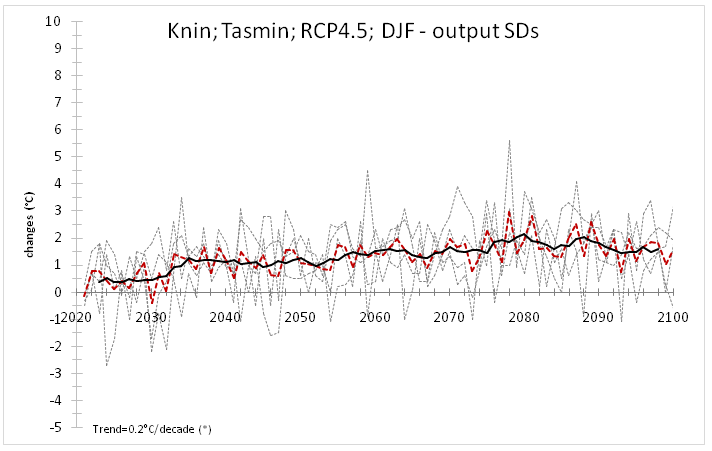
Averaged temperature change in Knin shows an increase on an annual scale as well as for single seasons, for all future periods (winter is an exception for one model in the near future). Although each model gives a different amplitude of change, in ensemble mean the change is highest during summer and the smallest in winter, for the moderate climate scenario. The temperature increase is more pronounced towards the end of the century with an increase of mean temperature of 1.6 °C in winter and 2.2 °C in summer. On an annual scale for the moderate scenario, temperature increase is for 1.8 °C. The amplitude of temperature change is more pronounced for high-emission climate scenario, reaching on annual scale 3.7 °C at the end of 21st century, 3.1 °C in spring and 4.4 °C in summer. The linear trend of temperature anomaly (Figure 1) in the future shows an increase which is statistically significant for both considered seasons and both the moderate and high-emission scenario; in winter it is 0.22 °C per decade for the moderate scenario and 0.57 °C per decade for high-emission climate scenario; in summer is 0.18 °C per decade for the moderate scenario and 0.53 °C per decade for the high-emissions climate scenario.
Figure 1: Variability of future 2m air temperature anomaly (in °C) in Knin for 2021-2100 obtained by dynamical downscaling for winter (DJF) and summer (JJA) and two emission scenarios, moderate (RCP4.5) and high-emissions (RCP8.5): individual models are in grey, the ensemble mean in red, 5-year moving average in black. A significant trend is marked with a star (ns if not significant).
2.1.2 Extreme high temperature
Extreme high temperatures (defined as 99th percentile of 2m air temperature) in Knin, is increasing. At the end of the century, for the moderate scenario, the warming ranges from 1.1 °C in winter to 2.7 °C in summer, 2.7 °C in an annual mean. For the high-emissions scenario, the amplitude of extreme high temperature rise is as high as 4.8 °C for annual change at the end of century, and from 3.0 °C in winter to 5.1 °C in autumn. That is even more pronounced when the maximum temperature is examined.
2.1.3 Extreme high maximum temperature
The change of extreme high maximum temperature in Knin (defined as of 99th percentile of 2m maximum air temperature), is increasing from first to last periods with the different amplitudes for each model and season. At the end of the century, the change of extreme high maximum temperature ranges from 1.9 °C in winter to 3.0 °C in autumn; 3.0 °C on annual scale for moderate climate scenario. The amplitude of change is more pronounced for high-emissions climate scenario and is between 3.7 °C in winter and 5.4 °C in autumn, 5.0 °C for annual change at the end of 21st century.
2.1.4 Extreme rare high temperature
Future change of 99.9th percentile of 2m air temperature (extreme rare high temperature) in Knin is increasing towards the end of the century with the different amplitudes for each model. A slightly negative change appears for some seasons of one model until the 2060, but the average change is positive for all periods. At the end of century increase is from 1.3 °C in summer to 2.6 °C in autimn, 2.3 °C on annual scale for moderate scenario. Amplitude of change is more pronounced for high-emissions climate scenario and is between 3.6 °C in winter and 5.3 °C in spring, 4.4 °C for annual change at the end of 21st century.
2.1.5 Extreme rare high maximum temperature
Analysing the future change of extreme rare high maximum temperature (defined as 99.9th percentile of 2m maximum air temperature) in Knin, we came to the same conclusion as for extreme rare high temperature. Some models show for some time slices small negative change, but in general, the ensemble mean for all seasons and annual change are positive. At the end of 21st century, changes are between 1.3 °C in summer and 3.4 °C in autumn, 2.2 °C for annual for moderate scenario. The amplitude of change is more pronounced for high-emissions climate scenario and is between 2.8 °C in summer and 5.2 °C in autumn, 4.2 °C for annual change at the end of 21st century.
2.1.6 Extra rare humidex projections
The change in extra rare humidex (defined by 99.9th percentile of humidex) in Knin will slightly increase towards the end of 21st century. The ensemble change is the biggest in spring: up to 2.4 for the moderate climate scenario and 6.3 for the high-emissions climate scenario. On annual scale, extra rare humidex will increase up to 0.9 for moderate, and up to 4.4 for the highest-emissions climate scenario. Variability of extra rare humidex anomaly shows significant positive linear trend for both seasons and both considered scenarios.
2 Results from statistical downscaling (SD)
2.2.1 Seasonal minimum and maximum temperature
The future projections show possible increases in seasonal minimum and maximum temperature from first to last period and, both emission scenarios. We can expect an increase in annual mean temperature around 1°C during 2021-2040 period, for both emission scenarios (moderate as well as high-emissions climate scenario). Going to the end of the century the projected increase in annual minimum temperature is around 2°C in the framework of moderate and around 3.7°C for high emissions climate scenario. The seasonal projected changes are expected to be more intense during summer and autumn seasons, with a peak of 4.5°C to the end of century. All projected changes in minimum temperature are significant from the statistical point of view. The long-term variability of seasonal changes of minimum temperature, represented in Figure 2 emphasizes a positive trend over 2021-2100, for both emission scenarios. A higher magnitude is expected to occur during summer of high-emissions climate scenario with a trend coefficient around 0.5°C per decade.
As regards maximum temperature, we can expect an increase between 1 °C at annual level during first period and 2.5°C at the end of century in the framework of moderate scenario. For the high-emissions climate scenario increase will be 5°C at the end of century. Seasonally, changes are more intense during spring and autumn, followed by summer and winter seasons.
2.2.2 Extreme temperature: 5th percentile of minimum temperature and 95th percentile of maximum temperature
Extreme temperatures reveal important future changes at Knin meteorological station. An increase in annual 5th percentile of minimum temperature of 1°C is projected during the first period (2021-2040) and up to 2°C to the end of century, in the framework of moderate scenario. The signal is even more intense for high-emissions scenario and especially during 2061-2080 and 2081-2100 periods, when the annual increases could reach 2.5°C and 3.5°C, respectively. At seasonal level, the highest amplitude of changes is during spring and autumn (up to 5°C).
The projections of future changes of 95th percentile of maximum temperature in Knin shows an increase in annual value of changes about 1.5°C for moderate and up to 3°C for high-emissions climate scenario at the end of 21st century. ). A deep analysis on projected changes reveals higher values during spring and autumn with peak of changes around 5°C at the end of century regarding high-emissions climate scenario.
2.2.3 Heat waves duration
The heat wave duration index is defined as the maximum number of consecutive days with maximum temperature greater than 90th daily percentile. The future climate projection in Figure 3 shows an increase during spring and summer in Knin. As could be observed, for moderate climate scenario the highest increase is in spring in the second part of scenario (around 16 consecutive days). For the high-emissions climate scenario the increase is about 49 consecutive days, both in spring and summer at the end of century.
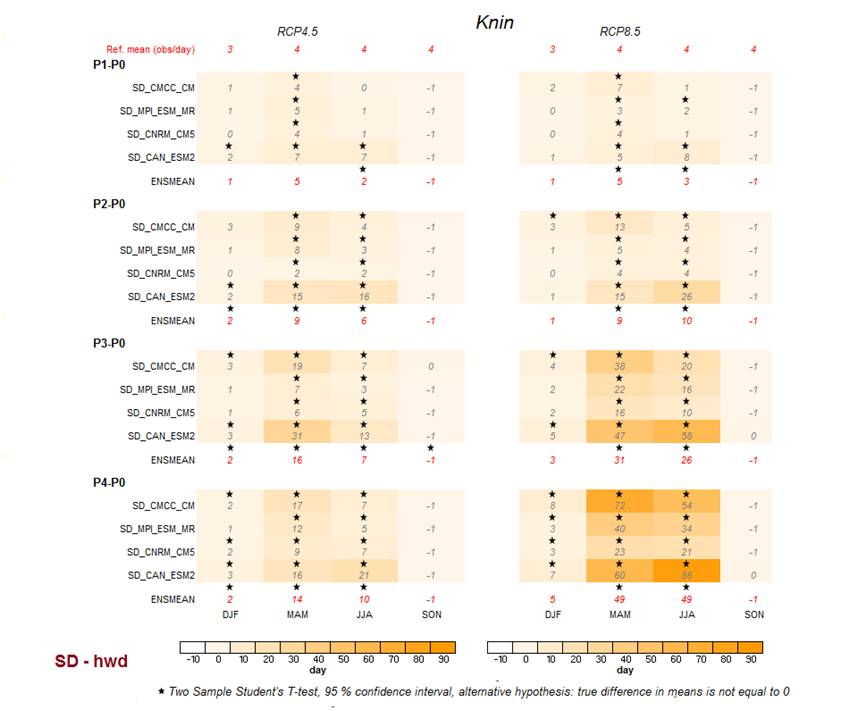
Figure 3: Seasonal heat wave duration: observed values over the reference period (in red), changes projected by statistical downscaling applied to 4GCMs and the Ensemble Mean of changes over the four periods (P1, P2, P3, P4) projected in the framework of RCP4.5 (left) and RCP8.5 (right). A significant change is marked by a star (Source ArpaeSimc)
2.2.4 Tropical nights
The analysis of the number of nights in which daily minimum temperature remains above 20°C in Knin shows a significant prolongation of those periods. The number of added summer tropical nights varies between 30 and 60 from the first to the last period for moderate scenario, For the high-emissions climate scenario it is between 36 and 83.
2.2.5 Frost days
The future projections of frost days, namely the number of days with minimum temperature lower than 0°C, show a decrease during winter, spring and autumn. The signal of changes is higher during winter season, with values between -6 days in first period and -12 days at the end of century for moderate scenario. The magnitude of changes is higher for RCP8.5, during winter last period it is around -20.
3 Precipitation related data
3.1 Results from dynamical downscaling (DD)
3.1.1 Averaged precipitation
Averaged precipitation obtained by dynamical downscaling is expressed in mm/day and its change in the future is shown as relative to the same reference period as for temperature. Precipitation is much more variable parameter than temperature, therefore there is not a unique sign of change neither through the year nor from model to model (Figure 4). The change in the models mean for Knin shows, for moderate climate scenario, an increase of precipitation in winter (3.2 %) and an decrease for all other seasons (the highest in summer, -9.1%). The same pattern is found for the highest-emission climate scenario, with more pronounced changes: 13.5% more precipitation in winter, and 9.6 % precipitation less in summer by the end of century. Annually, precipitation will decrease for 2.5% for moderate, and for 2.9% for the high-emissions climate scenario by the end of century.
Figure 4: Averaged seasonal and annual precipitation obtained by dynamical downscaling for Knin: Ref. mean is 20 years simulated period (1986-2005) for the ensemble mean in mmday-1; P1-P0, P2-P0, P3-P0, P4-P0 are the changes (in %) in the future for following periods P1: 2021-2040, P2: 2041-2060, P3: 2061-2080, P4: 2081-2100. Differences are shown for individual models. A significant change is marked by a star. Change is also shown as ensemble mean (ENSMEAN), not tested for significance. The left column is for the moderate scenario and the right one for the high-emissions scenario.
3.1.2 Intense precipitation
The amount of intense precipitation (defined by 95th percentile of precipitation) in Knin will increase in all seasons except summer. At the end of century, the increase will be the most pronounced in winter (7.4 % for moderate and 16.8 % for high-emissions climate scenario). In summer, it will decrease by -8.6 % for moderate scenario and -26.5 % for high-emissions climate scenario. On an annual scale, intense precipitation will increase, 3.3 % for moderate scenario and 5.7 % for high-emissions climate scenario.
3.1.3 Extreme precipitation
Extreme precipitation, defined by 99th percentile of precipitation, in Knin, shows the increase in all seasons and on annual scale. The increase ranges from 2.7 % in MAM to 18.9 % in DJF, 11.9 for annual scale for moderate scenario. If we keep on doing business as usual, the amount of extreme precipitation will grow by 28.9 % in winter and 18.4 % on an annual scale.by the end of 21st century.
3.1.4 Surface relative humidity projections
Seasonal and annual change of mean surface relative humidity (Figure 5) is shown by two available models realisation. Differences in signal change from one to other model indicate the need to use multiple models to be able to find the conclusion about the change in relative humidity. The ensemble mean of surface relative humidity change in Knin shows a small increase at the end of 21st century in all seasons as well as on annual scale for moderate scenario. The highest increase is in summer (2.1 %), for annual change is 0.9 %. The high-emissions scenario shows increase of surface relative in all seasons except summer. The highest increase is for winter (1.3 %), whereas in summer the amount of change will be the same, but with the opposite sign. It indicates that we will have slightly drier summers. On an annual scale, surface relative humidity will increase by 0.4 %.
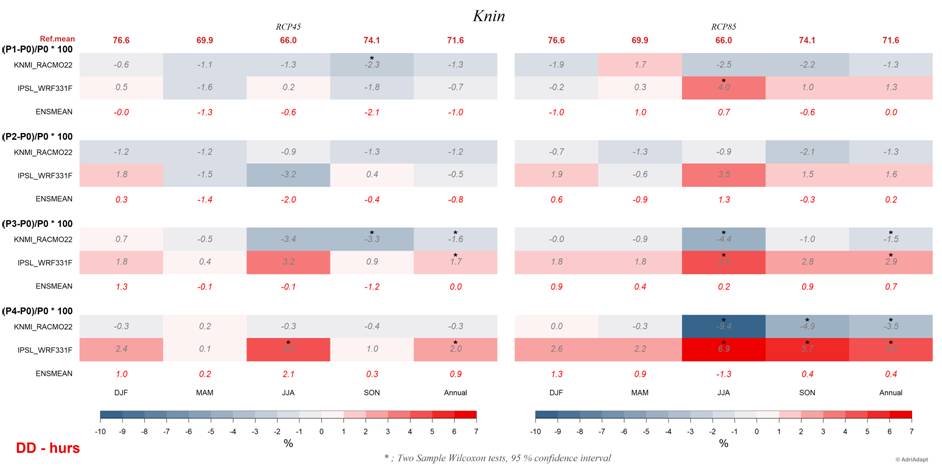
Figure 5: Seasonal and annual mean surface relative humidity (in %) obtained by dynamical downscaling for Knin: Ref. mean is a 20-year simulated period (1986-2005); P1-P0, P2-P0, P3-P0, P4-P0 are relative changes in the future for following periods P1: 2021-2040, P2: 2041-2060, P3: 2061-2080, P4: 2081-2100. Differences are shown for individual models. A significant change is marked by a star. Change is also shown as ensemble mean (ENSMEAN), not tested for significance. The left column is for moderate scenario and right for the high-emissions scenario.
3.2 Results from statistical downscaling (SD)
3.2.1 Amount of precipitation
The future change of precipitation obtained by statistical downscaling shows an overall decrease of precipitation. It will amount up to -20 % for moderate climate scenario and -30 % for high-emissions climate scenario. On seasonal change, precipitation will increase in winter for about 23% for high-emissions climate scenario, while for moderate scenario the signal of change is not entirely clear at the end of century. Opposite of that, clear signal of precipitation decrease in summer and autumn is shown for both scenarios at the end of century (up to -6% for summer and -57 % for autumn in the framework of high-emissions climate scenario).
3.2.2 Intense precipitation
Intense precipitation, defined by 90th percentile of daily precipitation shows for Knin a general slightly decrease at annual level. It will amount up to -9 % for moderate and up to -13 % for high-emissions climate scenario at the end of century. While at seasonal time scale, a decrease could occur in all seasons except summer for both scenarios, the high-emissions climate scenario project an increase of intense precipitation in summer for last two periods reaching 9% at the end of century.
3.2.3 Consecutive dry days
The consecutive dry days, defined as the maximum number of consecutive days without precipitation show for Knin an increase during spring, summer and autumn. Only in winter if show a decrease of consecutive dry days. The values of projected changes are significant at the end of century for high-emissions scenario, especially during summer and autumn, when the changes could reach 11 consecutive dry days more in summer and 13 more in autumn.